Concentration polarization (CP) is a major operational challenge for reverse osmosis (RO) desalination because it results in decreased permeate flux and increased transmembrane pressure (TMP). In this study, lab-scale and pilot-scale cross-flow filtration experiments were performed to evaluate the impact of air micro-nano bubbles (MNBs) on permeate flux, TMP and solute rejection. Results indicated that MNBs can increase permeate flux recovery up to 100%. Also, the permeate flux and solute rejection were increased up to 24.62% and 0.8%, respectively. These results are attributed to the disruption of the CP layer by MNBs. Furthermore, since this is a non-chemical, membrane cleaning in place (CIP) method, this does not contribute to environmental pollution, making it a more applicable cleaning method.
Desalination using membrane processes is one of the best-known solutions to produce fresh water from the seawater. In recent decades, nanofiltration (NF), reverse osmosis (RO), and forward osmosis (FO) membranes have been developed to be used in seawater desalination processes; however, RO is the only process that is conventionally being used. RO membranes can be of polymeric, inorganic/ ceramic, mixed matrix, or biomimetic fabrication. Among the polymeric membranes, thin film composite polyamide membranes (PA TFC) are most widely used. PA TFC membranes typically have a permeable polyester support layer for mechanical strength, and a cross linked polyamide active layer that exists as a thin-film on the permeable layer.
During the RO process, solute concentration near the surface of the membrane’s active layer increases over time due to accumulation of solutes that are being rejected by the membrane. This phenomenon is called concentration polarization (CP), and which is negatively correlated to the permeate flux for crossflow filtration processes. Membrane flushing is one of the methods that is able to help overcome the CP phenomenon. Although some studies looked into the prevention of fouling layer build-up using the microbubbles (MBs), the effects of MNBs on the CP layers of RO membranes have not yet been studied. Also in previous studies done on membrane cleaning, especially for treating the fouling layer build-up, the RO processes were stopped while the chemicals or the MBs were being applied. However, the MNBs in this study, were applied while the process was running to investigate the effect of MNBs on the CP layer.
In recent years, nanobubbles (NBs) diameter of < 900 nm and MBs diameter of ≤50 μm, have been investigated for water treatment because their physicochemical properties differ from those of larger bubbles. Micro-nano bubbles (MNBs) diameter of 800 nm–10 μm have relatively long lifetime in fluid streams, and high surface charge of the gas-liquid interface compared to macro bubbles [12]. Although there is no universally accepted classification for bubbles based on size, previous researches have classified bubbles as NBs, MBs and MNBs in terms of the diameter of bubbles. Nano bubbles do not exist under atmospheric conditions because of their high internal pressure based on the Young-Laplace equation,
where P is the gas pressure [Pa], Pi is the liquid pressure [Pa], σ is the surface tension of the liquid [N/m] and db [m] is the bubble diameter. Previous studies reported that the calculated internal pressure of a NB is around 0.15 MPa at 25 °C and atmospheric pressure. The high internal pressure causes the NBs to collapse within a short period of time, with an estimated lifetime of a 100 nm bubble being around 100 μs. Thus the formation of gas hydrates increases the stability of the MBs. The surfaces of MNBs in liquid have charges, which can be expressed in terms of zeta potential (ζ). This electrical property of MNBs determines the coalescence, interaction, and repulsion between the bubbles and other materials, such as organic, inorganic and biological substances, in water. Usually, the surface of a bubble is negatively charged and the corresponding ζ potential gives negative values, which means that surface charge varies with the pH. Also, ζ potential and lifetime of the bubbles depend on the diameter of the bubbles. With low pH values, more specifically, when pH value is under 4, MBs have positively charged gas-liquid surfaces. The repulsive forces between the MNBs result in turbulence in the liquid media. As such, MNBs have been used to agitate and remove the particulates from the membrane surfaces. Cui and Taha concluded that the permeate flux of the downward cross-flow ultra-filtration operation could be increased by 220% with the application of the gas-liquid two-phase flow to the feed stream. The reason behind the rapid permeate flux enhancement is the disruption of the CP layer by the air bubbles. Moreover, Ghadimkhani et al. demonstrated the de-fouling of ceramic membranes (CM) by feeding air NBs. After a fouled CM was cleaned using NBs, the permeate flow was restored from zero to its initial flow rate (5.33 × 10⁻⁹ m3/s) over the time period of 2 h.
Another important property of MNBs is the generation of hydroxyl radicals during the collapse of MNBs, which has been investigated for degradation of organic pollution and water disinfection. The addition of MBs to chemical cleaning solutions improves performance by agitating the fouling layer on membrane surfaces. In this study, therefore, we investigated the effect of MNBs on the reduction of the CP layer on the RO membrane surface.
In this study, lab scale and pilot scale experiments were conducted using RO membranes,. The saline water (35 g/L) was prepared by dissolving NaCl in deionized (DI) water and the pH of the solution was adjusted by using the 0.1 M NaOH solution.
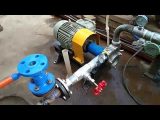
A flat rig crossflow unit (SEPA® cell) was used to conduct the lab scale experiments. As shown in Fig. 1, a high-pressure pump, agitator, feed tank, chiller, permeate tank and electronic balance with a PC logging system were configured to the cross flow unit. The effective membrane surface area was 128.25 cm2 , and membrane was outfitted with spacer plate on the feed side. The feed pressure was manually adjusted to 40 bar using a control valve on the concentrate line. The pilot-scale experiments were performed through the single- outpass spiral wound RO unit with the membrane surface area of 1.1 m2, which was connected to the online data logging unit to record the feed water flow, feed pressure, concentrated pressure, and the permeate water flow rate. The small volume of permeate was removed from the permeate water line to measure the conductivity. Temperature, conductivity, and pH were measured using a conductivity meter (Thermo; sn007617). A custom designed bubble generator (input: 220 V, 60 Hz, maximum flow rate: 65 L/min) was fixed to the feed water tank of flat rig unit. When the pilot-scale experiments were conducted, the bubble generator was unmounted from the flat rig unit and mounted to the feed water tank of the pilot-scale unit. An online particle counter (Malvern; ZEN3600, CA, USA) was used to measure the bubble size distribution.
Variation of permeate flux
For the first 3 h, the flat rig unit was operated at a constant temperature (25 °C). As shown in fig, the flux decreased by 15% due to the formation of the CP layer. At point A (175 min), MNBs (size range of 850 nm to 20 micrometers, Fig. 2) were applied without stopping the process. For about 20 min (point A–B) the flux increased, which is likely due to the disruption of the CP layer by the MNBs. The MNBs, which are compressed while being inside the pressure vessel, expand upon their entrance to the feed tank. This change in bubble structure generates heat due to the frictional forces acting between the bubble surfaces and the water molecules. However, the velocity of the collapsing bubbles in water is high enough that the temperature of the bubbles can increase quickly during this process. This resulted in a rapid temperature rise to 28 °C by point C (220 min), which lead to an increased permeate flux. Finally, 100% flux recovery was observed at 240 min.
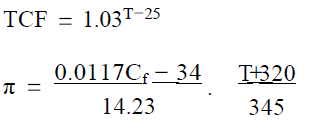
Temperature can significantly affect permeate flux in reverse osmosis. Therefore, the effect of temperature should be normalized to observe the effect of MNBs on permeate flux. Normalized permeate flux (NPF) can be calculated from temperature correction factor (TCF) and osmotic pressure (π) by using Eqs. (2), (3) and (4) obtained from the literature:

in where,
T = temperature [°C], Cf = feed concentration [mg/L], TCFs
= temperature correction factor at standard condition, TCFa
= temperature correction factor at actual condition [°C], Pfs = feed
pressure at standard condition [atm], Pfa = feed pressure at actual
condition [atm], πfs = feed osmotic pressure at standard condition
[atm], πfa = feed osmotic pressure at actual condition [atm],
Ja = permeate flux at actual condition [Liter/m2/h, LMH].
During the first 84 min of MNBs application flux increased from 17.22 LMH to 19.18 LMH as temperature increased from 14 °C to 20 °C. Calculated initial flux without MNBs (W/O MNBs) at 14 °C was 14.53 LMH, and then the contribution of bubbles for the flux incline is 18.51%. Like wise after 84 min the contribution is 26.93% (20 °C). This indicates that CP developed with the operation time, as expected. The experiment was continued until the temperature reached standard condition, and flux was normalized using (Eq. (4)) to allow comparison of initial and final flux values in the presence of MNBs to the flux values measured in the experiments W/O MNBs. The initial flux W/MNBs was calculated to be 22.77 LMH at 25 °C, and the Ministry of Land, Infrastructure and Transport of Korean government. The authors also thank Prof. Jang-Kun Song from the Display Device and Materials Lab, Sungkyunkwan University for his assistance in the instrumental analysis.
actual flux value was measured as 18.77 LMH (W/O MNBs). Then the contribution of MNBs is 21.31%. After 190 min, actual flux was 20.40 LMH W/MNBs and 16.37 LMH W/O MNBs, which demonstrates that MNBs increased permeate flux by 24.62%.
Variation of permeate flux, TMP and solute rejection
The pilot-scale experiment was conducted with the MNBs and the bubble generator was stopped after 90 min. During the experiment, feed pressure increased from 67.56 bar to 72.30 bar with the presence of the MNBs, and increased from 72.30 bar to 75.06 bar when MNBs were no longer applied the rapid increase in the TMP can be seen between 92 min and 108 min, which is due to the formation of the CP layer, lead in to a decrease in the permeate flux. From these results it can be seen that the consistent permeate flux is achievable in RO processes with MNBs, assuming there is no fouling issues, for MNBs disrupt the CP layer. The highest salt rejection was observed to be 97.4% with the MNBs and 96.6% without the MNBs. However since there are always formation of fouling on the membrane surface, whether it is organic or inorganic, further studies should be conducted to see if MNBs can further con- tribute in minimizing the flux decline with the presence of the fouling layer, or the factors that cause the build-up of the fouling layer.
From this study, it was found that the air MNBs play a significant role in reducing the CP layer. Also, the results from both lab-scale and pilot scale experiment shows that both permeate flux, and the solute rejection are improved with the presence of MNBs in the feed solution. This means that the use of NMBs can effectively remove and/or prevent the build-up of the CP layer. Also, this is a CIP method, which means that the MNBs can be applied without stopping the process. Being able to maintain or recover the flux without stopping the process can reduce the cost of the entire process, since it costs more energy to re-start the process. However, since CP is not the only factor that contributes to the flux decline, further studies should be conducted to see the effect of MNBs on other factors that leads to a decrease in flux, such as fouling phenomenon.


